Web Server Statistics for petwashsoap.allpawspetwash.com
Program started on Tue, Jul 31 2018 at 7:15 AM.
Analyzed requests from Thu, Jun 07 2018 at 2:09 AM to Mon, Jul 30 2018 at 8:20 PM (53.76 days).
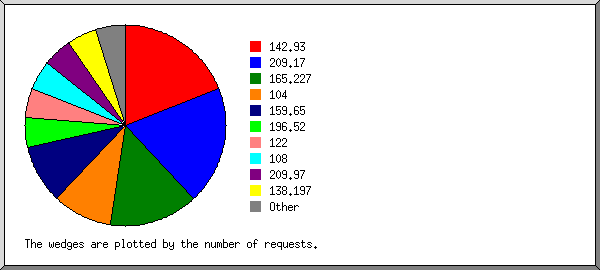
 ) represents 1 request for a page.
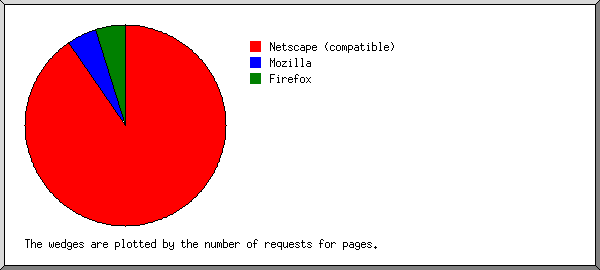
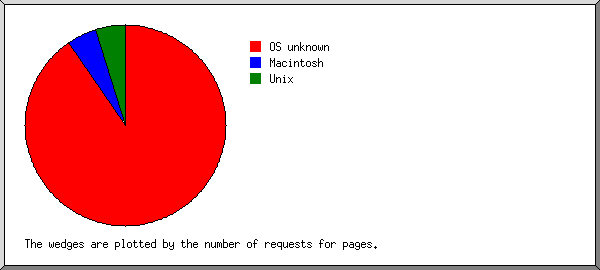